
San Mateo County Housing Market: July 2026 Competition
Peninsula Market Brief | July 2026
Fewer Sales, Stronger Sold Results: What July Reveals About Competition in San Mateo County
If fewer homes are selling, buyers should have more leverage—right?
Not necessarily. July had fewer San Mateo County single-family sales than a year ago, but the homes that closed performed more strongly against their final asking prices. A quieter market did not make every home negotiable.
That is the distinction I want buyers—and homeowners—to notice. County numbers provide context. The pricing, timing, and buyer interest around a particular home tell you whether that home calls for speed or negotiation.
July in 30 seconds
-
- The July MLSListings data included 13.5% fewer single-family sales than a year earlier.
- The homes that closed performed more strongly against their final asking prices than they did a year earlier.
- Average marketing time was unchanged year over year.
- The practical lesson: lower sales volume does not automatically create leverage on the home you want.
What changed in July
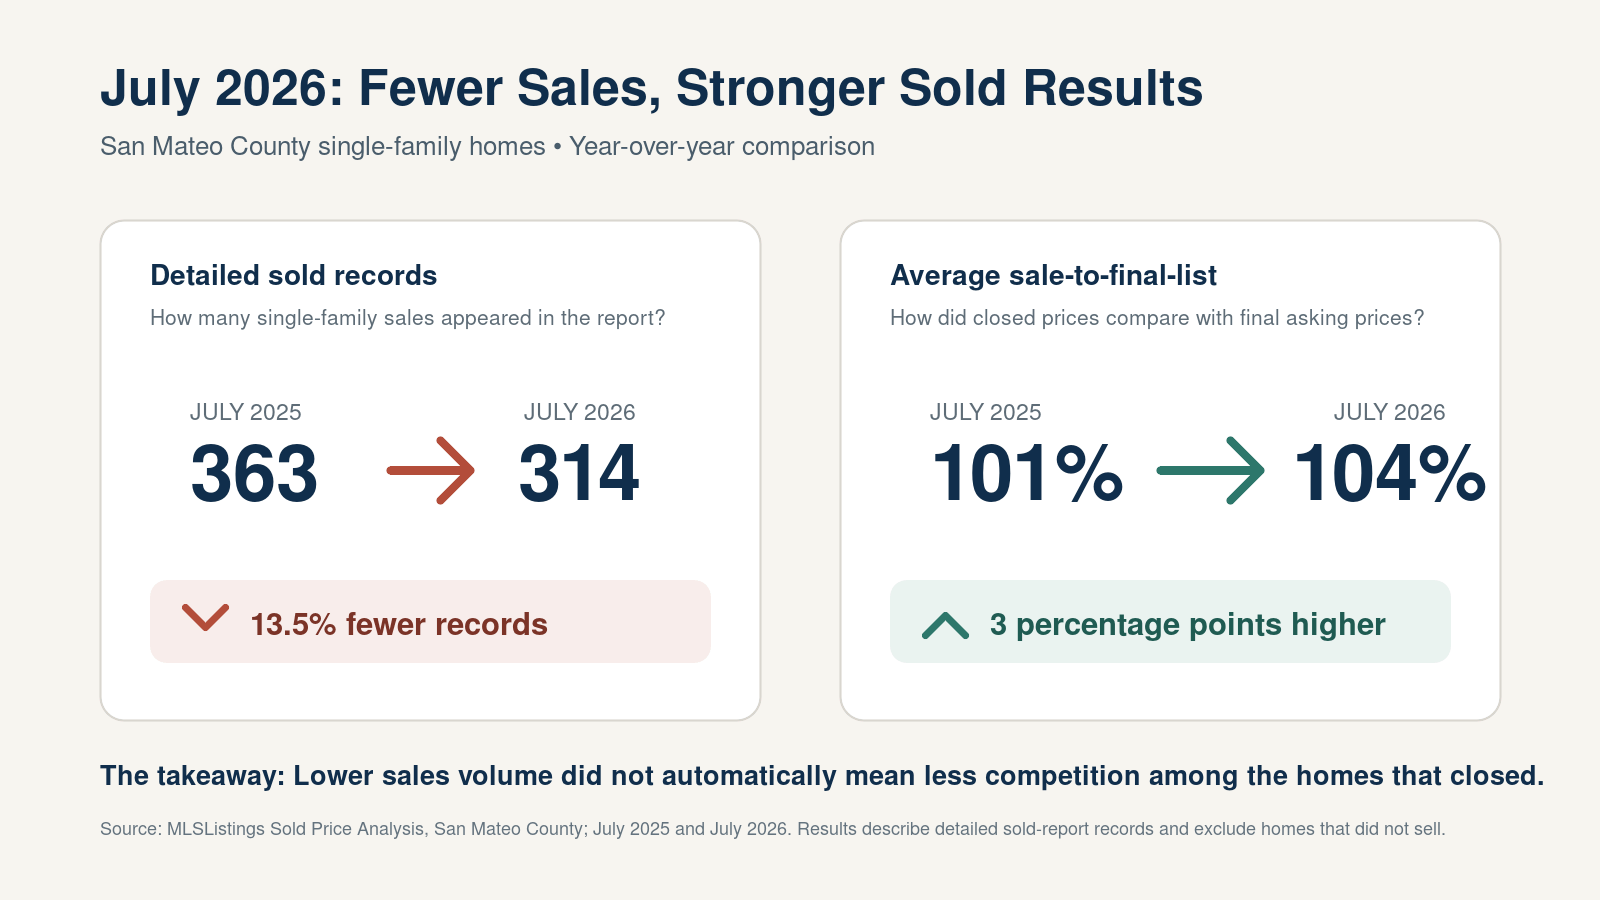
MLSListings' July data included 314 San Mateo County single-family sales, compared with 363 in July 2025. At the same time, the homes that closed averaged 104% of final list price, up from 101% a year earlier.
Average days on market was 25 days in both periods. Marketing time did not change year over year, even though fewer transactions appeared in the July data.
Two numbers, two different questions
Sales volume tells us how many homes closed. Sale-to-final-list tells us how those closed homes performed against their final asking prices. One does not automatically determine the other.
How can sales fall while sold homes perform more strongly against asking price?
Because the statistics measure different parts of the market. Fewer transactions can reach closing while many of the homes that do close still attract buyers willing to pay above the final asking price.
There is one important catch: that average describes the homes that sold. It does not include every property that stayed on the market or left the market without selling. Think of it as a view of successful July closings, not a promise about every listing.
What the average does not tell us
It does not mean every home sold above asking. It does not prove that most homes received multiple offers. And it does not tell us what caused an individual sale to finish above final list.
Among the July single-family sales with complete pricing data, 57% sold above final list price. Competition was meaningful, but it was not universal.
Does an above-asking result prove that a home received multiple offers?
No. The sold price shows the outcome, not how many offers produced it. One buyer could bid above asking, or several buyers could compete. Without offer-count data, we should not call every above-list sale a bidding war.
What to ask before you decide to compete or negotiate
The county trend can help you understand the backdrop, but it should not dictate your offer. When you find a home you like, bring the analysis down to that property.
Ask:
- What property type is it? Single-family homes and condominiums had very different July timelines and sold-price results.
- How long has it been on the market? Days on market can help frame seller expectations, especially when read alongside price changes and recent activity.
- How is the asking price positioned? Compare it with relevant recent sales and the home's specific features. List price is a strategy, not an independent measure of value.
- What condition and total-cost questions are known? Review disclosures, inspections, near-term repairs, insurance considerations, and recurring costs.
- What evidence is there of current buyer interest? Open-house activity, disclosure requests, offer timing, and communication from the listing side may matter more to your immediate decision than a county average.
This does not mean you should always move quickly or always negotiate. It means your strategy should come from the evidence around the property—not from one broad headline about sales being down.
Competitive, but less uniform than spring
Single-family homes averaged 106% of final list in March, compared with 104% in July. Among complete records, the share selling above final list declined from 71% in March to 64% in June and 57% in July.
These month-to-month figures are not adjusted for normal seasonal patterns, so I would not use them as a forecast. They do show that competition was less widespread than at the spring peak. It eased without disappearing.
One county, different amounts of time
In July, San Mateo County condominiums averaged 53 days on market and 99% of final list, compared with 25 days and 104% for single-family homes. Those averages can vary by city and building, and days on market does not establish the cause. Still, buyers did not experience the same pace or pricing conditions across every property type.
For a condo buyer, a longer marketing period may create more time to examine the building, monthly costs, disclosures, and comparable sales. It is not automatic negotiating power. For a single-family buyer, lower county sales volume should not create false confidence when the property itself is attracting interest.
Is San Mateo County becoming a buyer's market?
July's data does not support that broad conclusion. Some properties may offer buyers more time or room to negotiate. But the single-family homes that closed still averaged above final list, and many finished above it. The opportunity depends on the property.
For a deeper look at the property-level signals behind competition, see Why Some Peninsula Homes Get 10 Offers—and Others Don't.
A note for homeowners considering selling
The seller lesson is the mirror image. An above-list county average shows that strong single-family outcomes still occurred. It does not mean every list price will be validated. Buyers were not responding uniformly, and above-list results were less widespread than at the spring peak.
The better way to read a quieter market
July's numbers make more sense when we stop asking whether the entire county favors buyers or sellers. Fewer single-family sales closed than a year ago, but many of the homes that did close still produced competitive pricing results.
So use the county data as context, not as your bidding instruction. Then look closely at the home in front of you. That is where you will find the better answer about urgency and negotiating room.
If you are deciding whether a particular Peninsula home calls for speed or negotiation, I can help you read the property-level signals—pricing, days on market, property type, known condition questions, and current buyer interest. Reach out for a calm, evidence-based second look before you decide how to proceed.
Source: MLSListings Sold Price Analysis data for San Mateo County, July 2025 and July 2026. The comparisons use the date ranges provided by MLSListings and are not combined with counts from other reporting windows.
Categories
Recent Posts