
September 2026 Market Update: SF, San Mateo & Santa Clara
Monthly Market Update | September 2026
September 2026 Market Update: San Francisco, San Mateo, and Santa Clara Counties
A few of you have asked what the market looks like outside my usual San Mateo County focus—especially in San Francisco and Santa Clara County. So this month, I am zooming out.
Here is a bird's-eye view of those three counties: what they had in common, where the picture looked different, and what I would pay attention to if I were planning a move.
September in 30 seconds
- A larger share of single-family homes sold above the seller's final asking price in all three counties than a year earlier.
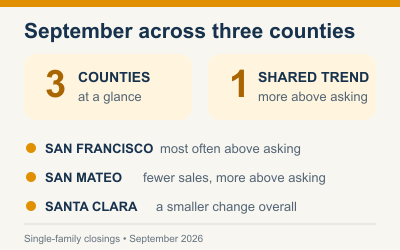
- San Francisco posted the strongest results. San Mateo strengthened despite fewer sales. Santa Clara changed more modestly.
- “Sold over asking” does not automatically mean multiple offers—or that a buyer overpaid.
A quick look at the three counties
Among the single-family homes that closed in September:
- San Francisco: 91.5% sold above final asking, up from 76.4%. Average market time shortened from 24 days to 20.
- San Mateo: 64.5% sold above final asking, up from 53.9%. The number of closings fell from 369 to 318.
- Santa Clara: 57.1% sold above final asking, up from 55.3%. The median price moved from $1.950 million to $1.875 million.
The common thread is simple, but the details matter: each county paired that higher above-asking share with a different mix of price, pace, and sales activity.
What “sold over asking” really tells us
The comparison above uses the seller's final asking price. That is important because an asking price is not always a prediction of market value. Sometimes it is part of the marketing strategy.
I often see homes listed below what buyers and agents may perceive as market value because the lower price can attract attention and encourage competitive bidding. That does not explain every September sale, but it is why I would never treat “sold over asking” as proof that a buyer overpaid.
Does selling above final asking mean there were multiple offers?
Not necessarily. These records do not include offer counts. There could have been two offers, ten offers, or one buyer who negotiated above asking for another reason.
They also include only homes that reached closing—not every home that was listed. I explained that distinction in more detail in July's San Mateo County market brief.
What caught my attention in each county
San Francisco: the strongest September results
In the MLSListings data reviewed, San Francisco had the strongest results of the three counties. Single-family homes sold faster, the median price rose, and above-asking sales became more common across every price range examined.
That does not mean every San Francisco home will behave the same way. It does mean buyers should be ready to evaluate a home's price and recent comparable sales promptly, while sellers should not assume the countywide numbers guarantee the same response for their property.
San Mateo: fewer sales, but stronger results
San Mateo County had fewer single-family closings than it did a year earlier. Yet the homes that closed sold above final asking more often, moved a little faster, and had a higher median price.
To me, this is a useful reminder that fewer sales do not automatically make the market easier for buyers. The homes that reached closing still produced stronger results than they did last September.
Santa Clara: a more modest and mixed change
Santa Clara County looked steadier. Single-family closings increased slightly, while average market time grew by two days and the median moved lower. The clearest strength appeared between $2.5 million and $5 million rather than across every price range.
A lower median does not mean every home lost value. The median can move because the mix of locations, sizes, conditions, and price points sold that month changed.
Condos told a different story
The condo results are another reason not to apply a single-family headline to every home.
In San Francisco, 68.8% of condo closings finished above final asking. San Mateo improved to 37.7%, with a nearly flat median. Santa Clara moved in the other direction: market time lengthened, the median fell, and 28.0% sold above final asking.
If you are buying or selling a condo, recent condo sales and the choices available nearby deserve more weight than a countywide single-family statistic.
What I would pay attention to
If you are buying: Look at the home's price history, recent comparable sales, nearby alternatives, disclosures, and the terms you can comfortably support. The list price may be a strategy—not a verdict on value.
If you may sell: Pay close attention to how buyers respond after launch. Location, condition, presentation, and pricing will matter more to your result than a county headline alone.
If you are curious about what September's numbers mean for your own plans, send me a note. Tell me the location, property type, and timing you are considering, and I will be happy to help you make sense of the part of the market that affects you.
Source: September 2025 and September 2026 MLSListings closed-sale records for San Francisco, San Mateo, and Santa Clara counties. Santa Clara's percentage uses 732 of 733 reported single-family closings. Closed-sale statistics do not describe every listing or establish how many offers a home received.
Categories
Recent Posts